(Note: These tutorials are meant to provide
illustrative examples of how to use the AMBER software suite to carry out
simulations that can be run on a simple workstation in a reasonable period of
time. They do not necessarily provide the optimal choice of parameters or
methods for the particular application area.)
Copyright Ross Walker 2006
AMBER ADVANCED WORKSHOP
TUTORIAL A5 - SECTION 7
The Nudged Elastic Band Approach to Finding the Lowest
Energy
Pathway Between two States
By Ross Walker
7. Extracting the Final Pathway and Visualizing the Results
Finally we can extract the final structures, calculate the Phi-Psi angle in each case and plot the points on our energy surface. There are a number of ways in which we could extract the individual structures along the pathway but I find the most convenient is to use ptraj to write a trajectory file for us where each structure in the trajectory corresponds to a single image along the pathway. Here is the ptraj input file:
trajin md-ala-neb_cool2.rst trajout md-ala-neb_cool2_final_pathway.mdcrd les split |
The important keywords here are "les split". This tells ptraj to split our LES style restart file into a trajectory where each frame is a single image.
$AMBERHOME/exe/ptraj neb.prmtop <extra_pathway.trajin
Input files: neb.prmtop,
md-ala-neb_cool2.rst,
extract_pathway.trajin
Output files:
md-ala-neb_cool2_final_pathway.mdcrd
The trick now is to use the original 'single' image prmtop file with the final_pathway trajectory file in vmd. You load the str1.prmtop file and then into this molecule (selecting crd (vmd1.8.3) or AMBER Coordinates(vmd1.8.4)) load the md-ala-neb_cool2_final_pathway.mdcrd file. This should load in a nice animation of the pathway. You can then use VMD's animation control tools to step through the structures in this pathway etc.
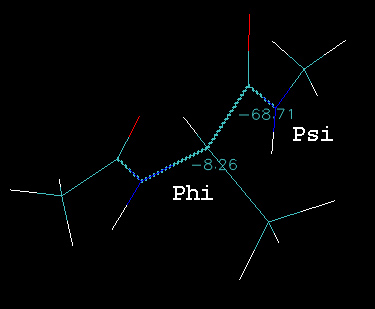
You can now use VMD to calculate the phi-psi angle of each structure in the loaded trajectory. Go to Mouse->Label->Dihedrals and then click on the atoms corresponding to Phi (C-N-CT-C) and Psi (N-CT-C-N). You should get a figure similar to that shown below (the exact numbers will be different depending on where you are along the pathway):
As you step through each image along the pathway you should see the numbers change. The animated gif image below shows the pathway rocking back and forth:
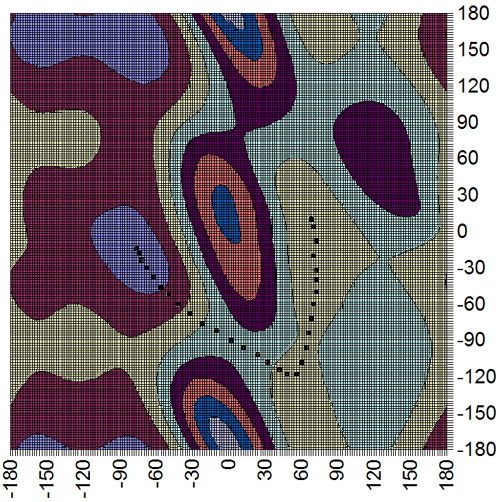
Finally we can step image by image along the pathway in VMD and note down the phi and psi angles and then plot them on an energy surface that I have generated for you:
 |
Psi |
|
Phi |
And there you have it the final pathway. As you can see we successfully found one of the 3 low energy pathways for this phi/psi transition. Note if we were to repeat the calculation with a number of different random number seeds for the thermostat we should eventually see each of the different pathways sampled a statistically relevant number of times.
(Note: These tutorials are meant to provide
illustrative examples of how to use the AMBER software suite to carry out
simulations that can be run on a simple workstation in a reasonable period of
time. They do not necessarily provide the optimal choice of parameters or
methods for the particular application area.)
Copyright Ross Walker 2006