(Note: These tutorials are meant to provide
illustrative examples of how to use the AMBER software suite to carry out
simulations that can be run on a simple workstation in a reasonable period of
time. They do not necessarily provide the optimal choice of parameters or
methods for the particular application area.)
Copyright Ross Walker 2006
AMBER ADVANCED WORKSHOP
TUTORIAL A5 - SECTION 6
The Nudged Elastic Band Approach to Finding the Lowest
Energy
Pathway Between two States
By Ross Walker
6. Slow Cooling
The final stage is to slowly cool the system down so that the images freeze out along the pathway. We will do the cooling in 2 stages. In the first stage we shall gradually cool down in 50 K steps over 120 ps using the following profile:
0 to 10ps : 300 K -> 250 K
10 to 20ps : Equil at 250 K
20 to 30ps : 250 K -> 200 K
30 to 40ps : Equil at 200 K
40 to 50ps : 200 -> 150 K
50 to 60ps : Equil at 150 K
60 to 70ps : 150 K -> 100 K
70 to 80ps : Equil at 100 K
80 to 90ps : 100 K -> 50 K
90 to 100ps : Equil at 50 K
100 to 110 ps : 50 K -> 0 K
110 to 120 ps : Equil at 0 K
Note since we are now back at 300 K and below we can safely switch back to using a 1 fs time step. Here is the input file:
|
120ps NEB ALA-ALA cool stage 1 &cntrl imin = 0, irest = 1, ntx=5, ntc=1, ntf=1, ntpr=500, ntwx=10000, ntb = 0, cut = 999.0, rgbmax=999.0, igb = 1, saltcon=0.2, nstlim = 120000, nscm= 0, dt = 0.001, ntt = 3, gamma_ln=1000.0, temp0=300, ineb = 1,skmin = 50,skmax = 50, nmropt=1 / &wt type='TEMP0', istep1=0,istep2=10000, value1=300.0, value2=250.0 / &wt type='TEMP0', istep1=10001,istep2=20000, value1=250.0, value2=250.0 / &wt type='TEMP0', istep1=20001,istep2=30000, value1=250.0, value2=200.0 / &wt type='TEMP0', istep1=30001,istep2=40000, value1=200.0, value2=200.0 / &wt type='TEMP0', istep1=40001,istep2=50000, value1=200.0, value2=150.0 / &wt type='TEMP0', istep1=50001,istep2=60000, value1=150.0, value2=150.0 / &wt type='TEMP0', istep1=60001,istep2=70000, value1=150.0, value2=100.0 / &wt type='TEMP0', istep1=70001,istep2=80000, value1=100.0, value2=100.0 / &wt type='TEMP0', istep1=80001,istep2=90000, value1=100.0, value2=50.0 / &wt type='TEMP0', istep1=90001,istep2=100000, value1=50.0, value2=50.0 / &wt type='TEMP0', istep1=100001,istep2=110000, value1=50.0, value2=0.0 / &wt type='TEMP0', istep1=110001,istep2=120000, value1=0.0, value2=0.0 / &wt type='END' / |
Lets run this now, it will take about 13 minutes to run on 1 cpu of a Pentium-D 3.2GHz machine:
$AMBERHOME/exe/sander.PIMD -O -i md-ala-neb_cool1.in -o md-ala-neb_cool1.out -p neb.prmtop -c md-ala-neb_anneal.rst -r md-ala-neb_cool1.rst -x md-ala-neb_cool1.mdcrd
Input Files: md-ala-neb_cool1.in,
neb.prmtop,
md-ala-neb_anneal.rst
Output Files:
md-ala-neb_cool1.out,
md-ala-neb_cool1.rst,
md-ala-neb_cool1.mdcrd
Normally we would be done at this point, however, the NEB method is extremely sensitive to there being any kinetic energy remaining. Even a small amount of kinetic energy can greatly effect the predicted pathway. E.g. take a look at the final results from the cooling run above:
NSTEP = 120000 TIME(PS) = 540.000 TEMP(K) = 0.00 PRESS = 0.0 Etot = -888.6417 EKtot = 0.0046 EPtot = -888.6463 BOND = 16.1334 ANGLE = 72.4586 DIHED = 316.1304 1-4 NB = 71.5424 1-4 EEL = 1312.9108 VDWAALS = -37.4381 EELEC = -2093.7117 EGB = -546.6721 RESTRAINT = 0.0000 |
As you can see there is still 0.0046 KCal/mol of kinetic energy present. This might seem like a tiny amount but it is essential that we try to remove as much of this as possible. To do this we will do one final 200ps long stage of cooling where we will set temp0=0.0 K and we will turn on the quenched velocity verlet method that was discussed in section 1 (vv=1). This should remove the last of the kinetic energy. Here is the input file:
|
50ps NEB ALA-ALA cool stage 2 &cntrl imin = 0, irest = 1, ntx=5, ntc=1, ntf=1, ntpr=100, ntwx=10000, ntb = 0, cut = 999.0, rgbmax=999.0, igb = 1, saltcon=0.2, nstlim = 200000, nscm= 0, dt = 0.001, ntt = 3, gamma_ln=1000.0, temp0=0.0, ineb = 1,skmin = 50,skmax = 50, vv=1,vfac=0.1 / |
This will take about 22 minutes to run on 1 cpu of a Pentium-D 3.2GHz machine:
$AMBERHOME/exe/sander.PIMD -O -i md-ala-neb_cool2.in -o md-ala-neb_cool2.out -p neb.prmtop -c md-ala-neb_cool1.rst -r md-ala-neb_cool2.rst -x md-ala-neb_cool2.mdcrd
Input Files: md-ala-neb_cool2.in,
neb.prmtop,
md-ala-neb_cool1.rst
Output Files:
md-ala-neb_cool2.out,
md-ala-neb_cool2.rst,
md-ala-neb_cool2.mdcrd
Lets take a look at the final step of this final cooling:
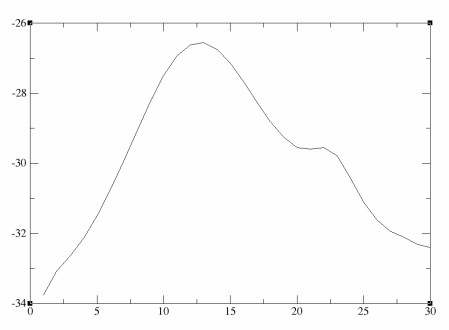
NSTEP = 200000 TIME(PS) = 740.000 TEMP(K) = 0.00 PRESS = 0.0 Etot = -896.9015 EKtot = 0.0021 EPtot = -896.9036 BOND = 16.1942 ANGLE = 71.7284 DIHED = 309.1552 1-4 NB = 71.5022 1-4 EEL = 1311.8589 VDWAALS = -37.1966 EELEC = -2104.9263 EGB = -535.2198 RESTRAINT = 0.0000 NEB replicate breakdown: Energy for replicate 1 = -33.7654 Energy for replicate 2 = -33.0651 Energy for replicate 3 = -32.6502 Energy for replicate 4 = -32.1257 Energy for replicate 5 = -31.4913 Energy for replicate 6 = -30.7533 Energy for replicate 7 = -29.9331 Energy for replicate 8 = -29.0721 Energy for replicate 9 = -28.2335 Energy for replicate 10 = -27.4946 Energy for replicate 11 = -26.9349 Energy for replicate 12 = -26.6137 Energy for replicate 13 = -26.5543 Energy for replicate 14 = -26.7422 Energy for replicate 15 = -27.1331 Energy for replicate 16 = -27.6610 Energy for replicate 17 = -28.2468 Energy for replicate 18 = -28.8051 Energy for replicate 19 = -29.2529 Energy for replicate 20 = -29.5457 Energy for replicate 21 = -29.5970 Energy for replicate 22 = -29.5503 Energy for replicate 23 = -29.7765 Energy for replicate 24 = -30.4228 Energy for replicate 25 = -31.1069 Energy for replicate 26 = -31.6143 Energy for replicate 27 = -31.9435 Energy for replicate 28 = -32.1101 Energy for replicate 29 = -32.3055 Energy for replicate 30 = -32.4029 Total Energy of replicates = -896.9036 NEB RMS = 0.138640 ------------------------------------------------------------------------------ |
Notice how the energies fluctuate along the pathway. It is probably easier to visualise this if we plot the energies. I have manually extracted these here: final_pathway_energies.dat.

As you can see there is 1 major maxima along this pathway and the overall barrier height is approximately 7 KCal/mol in one direction and 5 KCal/mol in the reverse direction.
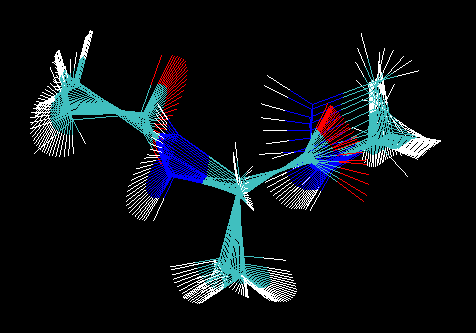
Next take a look at the structures in the final restart file in VMD. Load the neb.prmtop file (select parm7 in vmd 1.8.3 or AMBER7 Parm in vmd 1.8.4) and then into this molecule load the md-ala-neb_cool2.rst file (select rst7 in vmd 1.8.3 or AMBER7 Restart in vmd 1.8.4):

Notice how a number of the structures have the N-H groups on top of each other. This corresponds to moving along the valley on the right hand side of the energy surface. Here the C-O group is moving but the N-H group is remaining fairly static. The final step is to extract the pathway data from this restart file, create an animation of the pathway and then plot the position of each of the replicas on our energy surface.