Small molecule binding to T4-lysozyme L99A
This is the final part of this tutorial, concerned with analysing the MD runs
and constructing and interpreting the free energy curves. The first page with
background information is available here, the second
one with system setup information here
Running and Analyzing the MD simulations
After running all the simulations outlined in the previous page, we obtain a
tremendous amount of output data. This section shows how to analyze this so
that we finally obtain an estimate of the relative binding free energy of our
two ligands. A first step would be to take a look a the amber mdout files, to
see if anything went terribly wrong with our physical parameters. The following
tables give an overview over the output files from the six different
simulations:
Transformation: Remove charges from BNZ H6 - Medium: Water
| Lambda | DVDL | rms | ksteps | TEMP | rms | PRESS | rms | Density | rms | Filename |
| 0.100 | -5.424 | 1.193 | 100 | 299.55 | 5.96 | 2.8 | 360.7 | 0.9842 | 0.0038 | bnz_prod_v0_l1.out |
| 0.200 | -5.774 | 1.200 | 100 | 299.80 | 5.94 | 0.3 | 361.2 | 0.9833 | 0.0033 | bnz_prod_v0_l2.out |
| 0.300 | -5.968 | 1.199 | 100 | 300.07 | 6.23 | -0.7 | 358.2 | 0.9834 | 0.0042 | bnz_prod_v0_l3.out |
| 0.400 | -6.205 | 1.213 | 100 | 299.31 | 5.99 | 1.4 | 356.7 | 0.9839 | 0.0038 | bnz_prod_v0_l4.out |
| 0.500 | -6.488 | 1.250 | 100 | 299.50 | 5.95 | 1.9 | 347.2 | 0.9820 | 0.0035 | bnz_prod_v0_l5.out |
| 0.600 | -6.681 | 1.261 | 100 | 299.46 | 5.90 | -0.7 | 354.5 | 0.9841 | 0.0037 | bnz_prod_v0_l6.out |
| 0.700 | -6.977 | 1.281 | 100 | 299.53 | 6.23 | 0.7 | 357.2 | 0.9844 | 0.0032 | bnz_prod_v0_l7.out |
| 0.800 | -7.279 | 1.299 | 100 | 300.38 | 6.06 | 1.0 | 354.6 | 0.9818 | 0.0043 | bnz_prod_v0_l8.out |
| 0.900 | -7.445 | 1.308 | 100 | 300.14 | 6.07 | 4.9 | 357.4 | 0.9835 | 0.0043 | bnz_prod_v0_l9.out |
Transformation: Transform BNZ into PHN - Medium: Water
| Lambda | DVDL | rms | ksteps | TEMP | rms | PRESS | rms | Density | rms | Filename |
| 0.100 | 5.188 | 3.076 | 100 | 300.01 | 5.94 | 0.6 | 354.1 | 0.9824 | 0.0040 | bnz_prod_v0_l1.out |
| 0.200 | 4.404 | 3.033 | 100 | 300.29 | 5.82 | 2.3 | 354.0 | 0.9832 | 0.0037 | bnz_prod_v0_l2.out |
| 0.300 | 3.660 | 3.010 | 100 | 299.67 | 5.97 | -0.4 | 359.0 | 0.9835 | 0.0036 | bnz_prod_v0_l3.out |
| 0.400 | 2.523 | 3.112 | 100 | 299.80 | 6.06 | -0.8 | 357.1 | 0.9817 | 0.0045 | bnz_prod_v0_l4.out |
| 0.500 | 1.367 | 3.188 | 100 | 300.24 | 6.09 | -0.1 | 357.6 | 0.9830 | 0.0038 | bnz_prod_v0_l5.out |
| 0.600 | 0.602 | 3.468 | 100 | 299.52 | 6.04 | -1.2 | 362.6 | 0.9820 | 0.0036 | bnz_prod_v0_l6.out |
| 0.700 | -0.598 | 3.275 | 100 | 299.97 | 6.13 | -0.3 | 359.5 | 0.9831 | 0.0037 | bnz_prod_v0_l7.out |
| 0.800 | -1.757 | 3.102 | 100 | 300.21 | 6.15 | 4.1 | 368.2 | 0.9841 | 0.0041 | bnz_prod_v0_l8.out |
| 0.900 | -2.695 | 2.989 | 100 | 299.84 | 6.01 | 2.7 | 357.4 | 0.9817 | 0.0037 | bnz_prod_v0_l9.out |
Transformation: Add charges to PHN O1,H6 - Medium: Water
| Lambda | DVDL | rms | ksteps | TEMP | rms | PRESS | rms | Density | rms | Filename |
| 0.100 | -29.498 | 2.153 | 100 | 299.78 | 6.07 | 2.3 | 356.8 | 0.9850 | 0.0032 | phn_prod_v0_l1.out |
| 0.200 | -30.213 | 2.233 | 100 | 299.92 | 6.05 | 0.0 | 361.6 | 0.9834 | 0.0038 | phn_prod_v0_l2.out |
| 0.300 | -31.081 | 2.330 | 100 | 300.03 | 6.08 | 0.9 | 361.2 | 0.9835 | 0.0040 | phn_prod_v0_l3.out |
| 0.400 | -32.142 | 2.486 | 100 | 300.34 | 5.95 | 1.3 | 350.8 | 0.9831 | 0.0033 | phn_prod_v0_l4.out |
| 0.500 | -32.923 | 2.598 | 100 | 300.49 | 5.94 | 0.1 | 356.1 | 0.9824 | 0.0035 | phn_prod_v0_l5.out |
| 0.600 | -34.052 | 2.774 | 100 | 300.45 | 6.02 | 0.8 | 352.7 | 0.9833 | 0.0041 | phn_prod_v0_l6.out |
| 0.700 | -35.768 | 3.075 | 100 | 300.12 | 6.17 | 1.3 | 357.9 | 0.9826 | 0.0042 | phn_prod_v0_l7.out |
| 0.800 | -37.675 | 3.415 | 100 | 300.21 | 5.93 | -1.1 | 357.9 | 0.9826 | 0.0036 | phn_prod_v0_l8.out |
| 0.900 | -39.873 | 3.655 | 100 | 300.49 | 6.06 | 3.0 | 364.9 | 0.9831 | 0.0041 | phn_prod_v0_l9.out |
Transformation: Remove charges from BNZ H6 - Medium: Protein
| Lambda | DVDL | rms | ksteps | TEMP | rms | PRESS | rms | Density | rms | Filename |
| 0.100 | -5.380 | 0.697 | 100 | 299.99 | 1.67 | 0.2 | 135.8 | 1.0126 | 0.0011 | t4_bnz_prod_v0_l1.out |
| 0.200 | -6.381 | 0.726 | 100 | 300.04 | 1.70 | 2.1 | 134.0 | 1.0125 | 0.0012 | t4_bnz_prod_v0_l2.out |
| 0.300 | -5.967 | 0.823 | 100 | 299.87 | 1.70 | 0.9 | 136.0 | 1.0130 | 0.0012 | t4_bnz_prod_v0_l3.out |
| 0.400 | -6.368 | 0.831 | 100 | 299.90 | 1.67 | 0.6 | 136.8 | 1.0127 | 0.0011 | t4_bnz_prod_v0_l4.out |
| 0.500 | -6.502 | 0.733 | 100 | 300.02 | 1.68 | 1.6 | 133.1 | 1.0131 | 0.0010 | t4_bnz_prod_v0_l5.out |
| 0.600 | -6.887 | 0.712 | 100 | 300.19 | 1.63 | 0.1 | 137.5 | 1.0127 | 0.0013 | t4_bnz_prod_v0_l6.out |
| 0.700 | -6.747 | 0.764 | 100 | 300.09 | 1.71 | 1.1 | 135.7 | 1.0130 | 0.0011 | t4_bnz_prod_v0_l7.out |
| 0.800 | -6.885 | 0.803 | 100 | 300.02 | 1.67 | 0.8 | 136.0 | 1.0128 | 0.0011 | t4_bnz_prod_v0_l8.out |
| 0.900 | -7.104 | 0.766 | 100 | 300.15 | 1.68 | 1.5 | 137.6 | 1.0131 | 0.0013 | t4_bnz_prod_v0_l9.out |
Transformation: Transform BNZ into PHN - Medium: Protein
| Lambda | DVDL | rms | ksteps | TEMP | rms | PRESS | rms | Density | rms | Filename |
| 0.100 | 2.213 | 2.198 | 100 | 299.99 | 1.67 | 1.9 | 135.1 | 1.0129 | 0.0012 | t4_bnz_prod_v0_l1.out |
| 0.200 | 2.511 | 2.078 | 100 | 299.97 | 1.66 | 1.1 | 134.5 | 1.0128 | 0.0012 | t4_bnz_prod_v0_l2.out |
| 0.300 | 3.504 | 2.000 | 100 | 299.87 | 1.70 | 0.8 | 134.6 | 1.0130 | 0.0011 | t4_bnz_prod_v0_l3.out |
| 0.400 | 3.975 | 2.314 | 100 | 300.05 | 1.68 | 1.3 | 134.7 | 1.0130 | 0.0011 | t4_bnz_prod_v0_l4.out |
| 0.500 | 4.160 | 2.997 | 100 | 300.16 | 1.71 | 1.5 | 137.4 | 1.0126 | 0.0014 | t4_bnz_prod_v0_l5.out |
| 0.600 | 3.330 | 3.413 | 100 | 300.29 | 1.72 | 2.0 | 133.4 | 1.0126 | 0.0011 | t4_bnz_prod_v0_l6.out |
| 0.700 | 2.957 | 3.247 | 100 | 300.14 | 1.72 | 1.1 | 135.5 | 1.0128 | 0.0013 | t4_bnz_prod_v0_l7.out |
| 0.800 | 0.988 | 2.943 | 100 | 300.16 | 1.69 | 1.8 | 133.3 | 1.0128 | 0.0013 | t4_bnz_prod_v0_l8.out |
| 0.900 | 3.490 | 3.524 | 100 | 300.03 | 1.67 | 1.2 | 135.8 | 1.0124 | 0.0011 | t4_bnz_prod_v0_l9.out |
Transformation: Add charges to PHN O1,H6 - Medium: Protein
| Lambda | DVDL | rms | ksteps | TEMP | rms | PRESS | rms | Density | rms | Filename |
| 0.100 | -32.831 | 1.170 | 100 | 300.00 | 1.69 | 1.9 | 132.4 | 1.0129 | 0.0011 | t4_phn_prod_v0_l1.out |
| 0.200 | -33.164 | 1.169 | 100 | 300.09 | 1.66 | 0.4 | 134.2 | 1.0126 | 0.0013 | t4_phn_prod_v0_l2.out |
| 0.300 | -33.385 | 1.322 | 100 | 300.00 | 1.72 | 0.7 | 133.9 | 1.0126 | 0.0012 | t4_phn_prod_v0_l3.out |
| 0.400 | -33.828 | 1.271 | 100 | 299.98 | 1.74 | 1.1 | 135.0 | 1.0127 | 0.0012 | t4_phn_prod_v0_l4.out |
| 0.500 | -33.840 | 1.247 | 100 | 300.06 | 1.69 | 0.6 | 136.6 | 1.0128 | 0.0012 | t4_phn_prod_v0_l5.out |
| 0.600 | -34.164 | 1.189 | 100 | 300.00 | 1.68 | 1.3 | 134.9 | 1.0133 | 0.0011 | t4_phn_prod_v0_l6.out |
| 0.700 | -34.454 | 1.293 | 100 | 299.98 | 1.69 | 1.9 | 137.1 | 1.0130 | 0.0013 | t4_phn_prod_v0_l7.out |
| 0.800 | -34.659 | 1.341 | 100 | 300.01 | 1.70 | 1.1 | 137.7 | 1.0127 | 0.0015 | t4_phn_prod_v0_l8.out |
| 0.900 | -34.388 | 1.318 | 100 | 299.93 | 1.67 | 1.1 | 133.9 | 1.0131 | 0.0011 | t4_phn_prod_v0_l9.out |
We see temperature fluctuation in the range of 5K for the ligands in water and
2K for the complexes, about what one would expect. The pressures fluctuate
wildly as always when ntp=2 is used, but densities stay relatively
constant. dV/dλ rms values are in the range of several kcal/mol. In an
actual study, this quick glance over the results would need to be replaced with
a careful analysis of all the trajectories to see if interesting conformational
changes or ligand movements happen, but it shall suffice for the purpose of
this tutorial. Therefore we can proceed to analysing the resulting dV/dλ
vs. λ curves.
Results
The plot below shows the dV/dλ curves assembled from 9 λ points
each. We can see that the curves for transformations in water are smoother than
those for the ligand change in the protein, as would be expected due to the
more complex conformational landscape of a protein-ligand complex as compared
to an isotropic solution. The vdW-transformation in the complex shows the
biggest fluctuations of dV/dλ and the free energy curve for Step 2 in the
complex is the one that looks the most 'bumpy'. Since TI-free energy curves are
almost always smooth curves, this can probably be attributed to insufficient
sampling and running longer simulations for the transformations in complex
would most likely smooth out the free energy curves considerably.
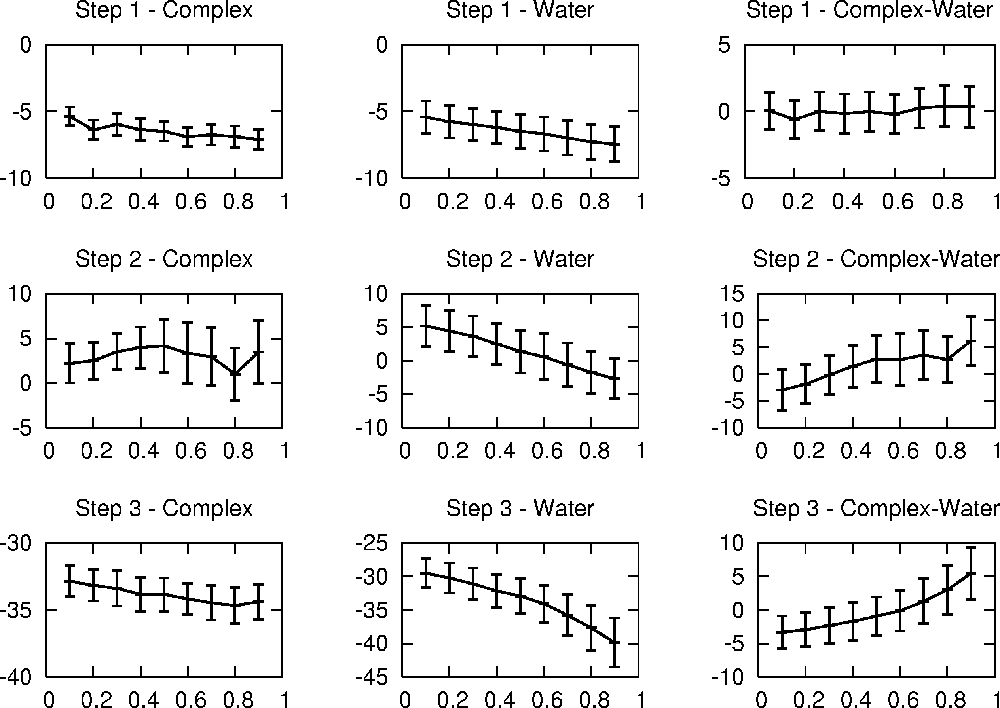
The thermodynamic effect of removing the charge on the hydrogen atom is small
and very similar when done in complex or solution. Adding the charges to the
phenyl group (step 3) gives much bigger changes in energy than the other two
steps, but bear in mind that the result of a single transformation is not a
physically significant number, only differences between the results of two
transformations are. The free energy change associated with each of the steps
can be calculated by numerically integrating over the ΔG(Complex-Water)
curves on the right from λ=0-1. The integration can e.g. be done using this script on a list with λ, dV/dλ and
rms(dV/dλ) values like that one). The
trapezoid rule (values for λ=0 and 1 were linearly extrapolated from the
closest two values) gives:
| Step | Free Energy change | rms |
|
| ΔG (Step 1) | 0.05 | 1.46 |
| ΔG (Step 2) | 1.72 | 4.19 |
| ΔG (Step 3) | 0.06 | 3.04 |
|
| ΔG (Total) | 1.83 | 5.34 |
Interestingly, the main contribution to the binding free energy difference
stems from vdW interactions and not from electrostatics. One would have
expected that the loss of solvation on the polar hydroxyl group might strongly
influence the relative binding free energies, but from this calculations, the
main difference seems to be the sterical effect of accomodating the bulkier
hydroxyl group in the binding site, with electrostatics playing a minor
role. This result might however change if the calculation would be refined
further.
Our prediction is that phenol binds 1.8 kcal/mol weaker to T4-lysozyme than
benzene. While this is not in perfect agreement with experimental data, it
captures the trend of benzene being the stronger binder. To improve the result,
more simulations could be added at different λ points (this is indeed
one of the strong points of TI, you can add as many additional data points as
you want to refine your result without having to redo the initial
calculations) or more sophisticated numerical integration schemes could be
used. The rms value of the final result should not be mistaken for the
statistical uncertainty of the result. To get a good error estimation, some
additional analysis is required (see e.g. Steinbrecher T. et al., J
Chem. Phys. 127, 214108, 2008).
This tutorial was written by Thomas Steinbrecher, TSRI 2007