


Steered Molecular Dynamics of a Proton Transfer Reaction
 In addition to the Steered MD (SMD)
approach described starting on page 108 of the manual, a new set of
Adaptively Biased MD and related methods has been introduced for
Amber10 (See page 121 and also be aware that this tutorial uses an
Amber11 addition, LCOD, to these methods.
Adding LCOD capabilities to Amber10 is
described below). The whole Adaptively Biased MD section (4.6) should
be studied for background to this tutorial. The new implementation
of the SMD method specifically is described
starting on page 125.
In addition to the Steered MD (SMD)
approach described starting on page 108 of the manual, a new set of
Adaptively Biased MD and related methods has been introduced for
Amber10 (See page 121 and also be aware that this tutorial uses an
Amber11 addition, LCOD, to these methods.
Adding LCOD capabilities to Amber10 is
described below). The whole Adaptively Biased MD section (4.6) should
be studied for background to this tutorial. The new implementation
of the SMD method specifically is described
starting on page 125.
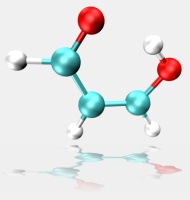
The tutorial is a brief test case using steered MD to force an intramolecular proton transfer (PT) in malonaldehyde (pictured). The simulation was carried out in vacuum with the QMMM DFTB Hamiltonian using the LCOD (linear combination of distances) reaction coordinate. The QM region consisted of the whole molecule. These results should be compared with the Empirical Valence Bond (EVB) section, specifically to Figure 3.4 (page 77, closed triangles). As indicated above the LCOD reaction coordinate is new for Amber11, but the code (and instructions) for Amber10 are available here.
A topology file and initial coordinates are needed to begin the
SMD simulation. These were taken from these two files found in the normal amber distribution:
$AMBERHOME/test/evb/malon_bond_umb_GAFF/mr.top
$AMBERHOME/test/evb/malon_bond_umb_GAFF/mr.crd
The system should be equilibrated to the forcefield in all molecular dynamic studies, so 500000 steps of 0.5fs/step (250ps) restrained dynamics were carried out (please get the files here). The qmshake algorithm was turned off because we want to study a PT reaction. The donor and acceptor oxygen atoms were restrained to 2.5 angstrom separation. The starting structures for a SMD study should be restrained in order to sample the ensemble of the reactant structures, and initial structures for SMD should be drawn from this ensemble for each separate simulation replicate. Additionally, in this specific PT example, the barrier height is sufficiently low that a substantial portion of the trajectories will yield unforced PT events unless a restraint is used. During the equilibration step the temperature will vary quite a lot. This is to be expected for such a small system.
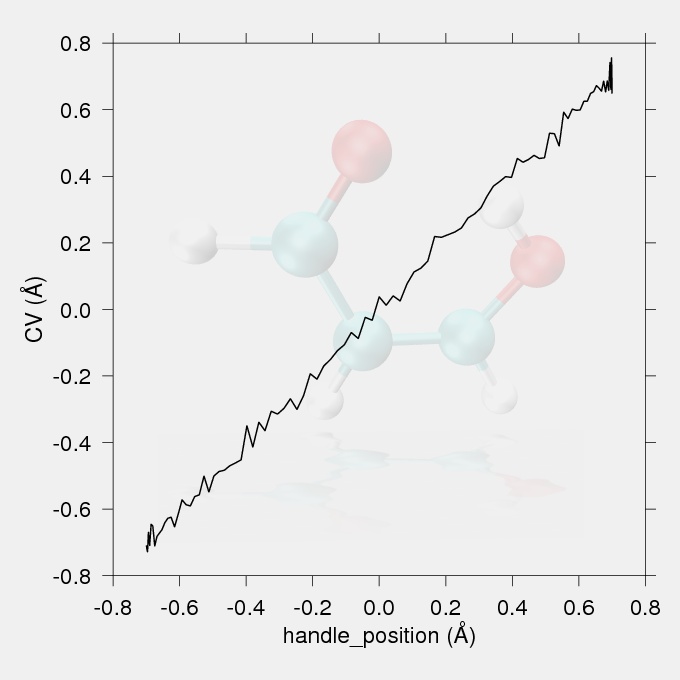
Fig.1 The reaction coordinate (the difference in acceptor-hydrogen and donor-hydrogen distances) vs. handle position (the position of the minimum of the harmonic restrain) plot.
The production run is one replicate of a SMD study. In a real study several replicates should be carried out starting with different structures drawn from the reactant ensemble. The work vs. reaction coordinate curves generated by the replicate production runs would be Jarzynski averaged to generate the potential of mean force. The production run conditions feature 100000 steps of 0.5fs (50ps) with qmshake turned off. The LCOD reaction coordinate used is the difference in acceptor-hydrogen and donor-hydrogen distances, and is varied from 0.7 to -0.7 angstroms. The same strong harmonic restraint that was used in the equilibration step was used to force the reaction (please get the files here).
ncsu_smd

   output_file = 'smd.txt'
   output_freq = 1000

   variable
      type = LCOD ! Linear Combination of Distances
      i = (8,9,7,9)
      r = (1.0,-1.0)
      path = (0.7,-0.7)
      harm = (1000.0)
   end variable

end ncsu_smd
Fig.2 The ncsu_smd section of the input file. The i list gives the atom numbers to be included in the linear combination (there should be at least four, but larger even numbers of atoms are allowed). The r list gives the coefficients of the linear combination (one for each two numbers in the i list). In this case the value of the reaction coordinate (collective variable, CV) is 1.0 * distance(8,9) - 1.0 * distance(7,9) where distance(i,j) is the distance between atom i and atom j.
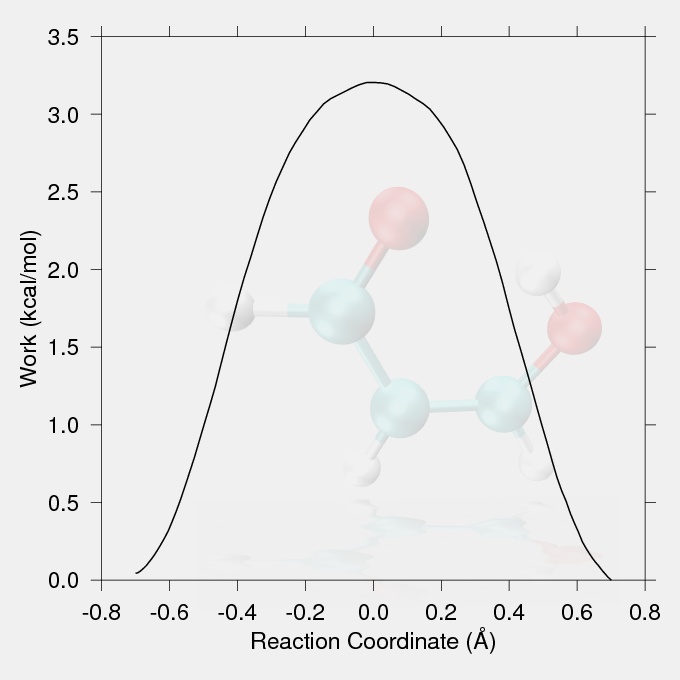
The data for the work vs. reaction coordinate and the reaction coordinate vs. handle position (the position of the minimum of the harmonic restraint on the reaction coordinate) plots were taken from the output file smd.txt. The reaction coordinate vs. handle position plot (Fig.1) should show a proportionality between the targeted handle positions and the achieved CV values, with no large discontinuities. The work values from the output files of the replicates should be Jarzynski averaged to give the potential of mean force.
The following questions arise during this tutorial:
- How much difference in the reaction barrier height might be expected if some other Hamiltonian rather than DFTB were used. (Change DFTB to, e.g., PM3 to find out.)
- How many replicates might be needed to get a reliable PMF by Jarzynski averaging? How might the variance of the final PMF be quantitatively estimated?