


Using mdgx to manipulate small molecules
Whether you are a beginner or a seasoned user, molecular dynamics is about
sampling relevant conformations of a molecule on a rugged energy surface. It
is common to find the molecule trapped in one conformation or another, with
steep energy barriers on all sides. For some applications, it is important to
understand the heights of these barriers and the relative depths of the wells
that different conformations represent. For other situations, it is simply
important to find new local minima, perhaps with some geometric stipulations
about the rest of the molecule. If the system is small, the mdgx
program in AmberTools offers an effective, accessible CPU-based platform for
computing hundreds of a molecule's local minima at one time. This facility is
the &configs module. It is utilized in
other
tutorials, but this page will
provide a dedicated overview of its features. Some of the other literature on
this module, in particular the manual inside the mdgx executable
itself, refers to different configurations but the terms should be taken
as interchangeable.
The basic operations of the module are:
- Read a single topology file.
- Read one or more input conformations.
- Read a series of restraint operations with ranges to differentiate the target coordinates.
- Read some minimization run conditions (number of cycles, step size, etc.
- Perform minimization using steepest descent followed by conjugate gradient methods.
- Prune conformations that do not meet criteria for tolerable strain.
- If requested, shuffle and recycle successful optimizations as the initial conformations for another round of optimizations. (This can be repeated as required and is an effective method for jumping out of local minima as well as reaching restraint targets with a minimum of restraint strain.)
- Report general statistics on conformations produced and the specific flaws in any rejected conformations.
- Print successfully optimized conformations to an Amber trajectory, PDB files, or quantum chemical program inputs.
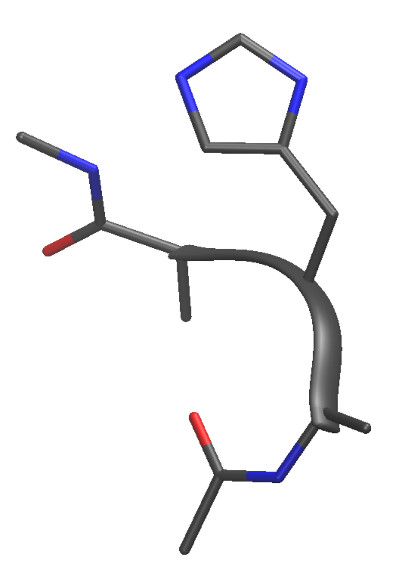
Here is a small peptide that can nonetheless sample thousands of unique minima:
All of the input mimics the sander &namelist format, but
some of it is more intuitive as will be discussed. Here is basic input that
illustrates all of the above concepts in the &configs module. The topology
HID.top and associated initial coordinates
HID.crd are actually a tetrapeptide
Ace-Ala-Hid-Ala-Nme. We will continue to refer to this system as we make the
input more elaborate.
&files

  -p     HID.top

  -c     HID.crd

  -o     cfsamp_I.out

&end


&configs


  % Backbone phi and psi sampling

  GridSample  :2@C  :3@N  :3@CA :3@C
{ -180.0 180.0 }  fbhw  10.0  Krst 64.0,

  GridSample  :3@N  :3@CA :3@C  :4@N
{ -180.0 180.0 }  fbhw  10.0  Krst 64.0,

  combine 1 2,


  % General minimization instructions

  count = 64,

  verbose 1,

  maxcyc = 5000,

  strainlim = 20.0,

  bstrain = 10.0,

  astrain = 10.0,


  % Reshuffling conformations to best achieve each minimum

  nshuffle = 2,

  shuffle bootstrap,


  % Output controls

  outbase 'Conf', 'Conf',

  write   'cdf',  'pdb',

  outsuff 'cdf',  'pdb',

&end
The command file looks a lot like sander &namelist input,
on purpose. However, it is C underneath emulating the look and feel, and there
are some important extensions. It is not necessary to specify commas after
every argument, or even the "=" sign, in fact. More significant, certain
keywords will trigger mdgx to take in many subsequent arguments, often in a
free format order. It is a sort of keyword list within a keyword list, and the
only requirement is that all of the grouped keywords appear on the same input
file line. The GridSample keyword is a great example: it triggers
a search for subsequent keywords like "{ }" (beginning and end of value range),
"fbhw" (Flat Bottom Half Width) and "Krst" (harmonic restraint stiffness). Any
other values it finds (until it finds another &namelist-specific keyword)
are going ot be assumed to be ambmask atom masks specifying a
single atom. If it finds two such masks, it says "bond restraints." Three,
"angles," and four, "dihedral restraints." All of this is in the service of
making NMR-like restraints with an array of target values covering the range.
The mdgx onboard manual is a good reference for additional
keywords in the &configs namelist. Run
mdgx -CONFIGS on the command line to see this namelist
description. (Note: most of these keywords are case-sensitive.
All that may look complicated, but it accomplishes things that would take a long, dedicated bash script driving sander to do the same thing. Such a script would be full of awk commands to post-process intermediate outputs as the MD program performed a total of 128 optimizations. The input above should run in under a minute, and when it does the following things happen:
- 64 conformations are produced, sampling conformations of the center residue's Φ and Ψ coordinates every 45°, starting from the initial state in HID.top. The "combine" keyword is crucial here: it splits the sampling across two dimensions given in restraints "1" and "2." Without it, the restraints would increment at the same time, making a line of conformations with Φ and Ψ increasing at the same time.
- The results of the first round of energy minimizations are reshuffled and become input coordinates for the same set of targets. The reshuffling follows a 'bootstrap' approach: random reordering, with replacement. For each minimization, a random number between 1 and 64 is chosen, and that number points to the minimized conformation produced with one of the Φ / Ψ restraint targets. The same solution can become an input to more than one subsequent optimization with 'bootstrap.' For random resampling without replacement, choose a 'jackknife' shuffle.
- If the next round of optimizations produces structures with lower energy than the first round, they are accepted and replace the first round solutions.
- The shuffling process is repeated a second time.
- Conformations wherein the sum of all restraint penalties in the problem exceeds 20.0 kcal/mol, or any one bond or angle is strained by more than 10.0 kcal/mol, are purged form the results, not printed to the output. Only the best conformation for each Φ / Ψ target is printed, but statistics will be reported for the success rate and progress made by the reshuffling.
- Acceptable conformations are printed in NetCDF and PDB formats.
To run this example, download the HID topology and associated coordinates, then run the mdgx executable with the above input (I've called the command file cfsamp_I.in):
>> ${AMBERHOME}/bin/mdgx -O -i cfsamp_I.in
The output, which the reader may examine as needed, indicates several important aspects of the run. First, the average energies for all conformations improve considerably with respect to the force field guiding the optimization.
Initial E(Model)         42.3151
0.0000      42.3151      42.3151

Initial E(Restraint)    149.8428     77.9343
     1.0140     314.4673

Final E(Model)          -12.8046
5.0342     -22.2319       0.0364

Final E(Restraint)        0.2397
0.3362       0.0000       1.8405

Delta E(Model)          -55.1197
5.0342     -64.5469     -42.2787

Delta E(Restraint)     -149.6031
 78.0114    -314.1727      -0.6323

Reoptimization           -1.2848
  2.4688      -9.8811       0.0000
All structures started from one initial state, so the standard deviation in their initial energies is zero. The minimizations required, on average, 1745 steps to converge, all configuration minimizations did converge, and all resulting structures passed the sanity checks. There were 18 successful reoptimizations and 17 of these produced lower energy configurations than the original attempts.
No motivation was given for optimizing this tetrapeptide all over its Φ and Ψ space, but the example comes from a protein force field development project wherein conformations were needed for charge fitting to quantum electrostatic potentials. In order to get a good result that can guide force field development of a fixed charge model, it is important not to let the molecule get into conformations that would change its electronic state. Hydrogen bonding is the biggest risk along those lines, so it is important not to let any of the conformations bring a hydrogen donor too close to another atom with a free Lewis electron pair. Visual inspection is tedious, error prone, and subjective. Instead, we will add the following input to prevent hydrogen bonding between atoms of subsequent residues in the backbone:
  Set   :1@O  :2@H  { 50.0 50.0 }  fbhw 47.5
Krst 64.0,

  Set   :1@O  :3@H  { 50.0 50.0 }  fbhw 47.5
Krst 64.0,

  Set   :1@O  :4@H  { 50.0 50.0 }  fbhw 47.5
Krst 64.0,

  Set   :1@O  :5@H  { 50.0 50.0 }  fbhw 47.5
Krst 64.0,

  Set   :2@O  :3@H  { 50.0 50.0 }  fbhw 47.5
Krst 64.0,

  Set   :2@O  :4@H  { 50.0 50.0 }  fbhw 47.5
Krst 64.0,

  Set   :2@O  :5@H  { 50.0 50.0 }  fbhw 47.5
Krst 64.0,

  Set   :3@O  :4@H  { 50.0 50.0 }  fbhw 47.5
Krst 64.0,

  Set   :3@O  :5@H  { 50.0 50.0 }  fbhw 47.5
Krst 64.0,

  Set   :4@O  :5@H  { 50.0 50.0 }  fbhw 47.5
Krst 64.0,
Looks can be deceiving: if the goal is to keep two atoms apart, why add
restraints that will compel them to come together? The trick lies in the range
of the restraints. Two masked atoms tell mdgx "distance" and the
program then looks for a range inside of the { } braces. The upper and lower
bounds of this range are 50Å, but there is another important number: the
Flat Bottom Half Width. Setting this to 47.5Å turns the restraint into:
"let the atoms get up to 97.5Å apart (which they never will), but if they
get closer than 2.5Å start applying a 64 kcal/mol harmonic penalty." This
will effectively block the molecular mechanics model from forming anything like
a hydrogen bond.
Another important feature of a force field training set is sampling in the relevant degrees of freedom. The position of the side chain should vary from one conformation to the next, but perhaps not in a systematic way alongside the backbone. In order to accomplish this, we can add a RandomSample instruction. RandomSample works like GridSample, but the restraint values are randomly chosen from within the range given in { }. No "combine" keyword is needed to decorrelate RandomSample instructions. The restraint stiffness is also reduced in this case, to let the conformations stick to one rotamer or another.
  RandomSample  :3@CG  :3@CB  :3@CA  :3@N
 { -180.0 180.0 }  Krst 16.0,

  RandomSample  :3@ND1 :3@CG  :3@CB  :3@CA
{ -180.0 180.0 }  Krst 16.0,
The input file is here. The Flat Bottom Half Width is of little consequence with this lighter restraint, but still we can see that there are conformations that fail the sanity checks:
 - Configurations passing all sanity checks:       60

 - Configurations failing bond sanity check:
   0

 - Configurations failing angle sanity check:       0

 - Configurations failing restraint sanity check:   4
The failures are described in the next section of the
output. These exercises also generate
loads of PDB files and two amber trajectories. The PDB files, one of which
from the second exercise is here, are a very
low-density, low-precision way to record the output, but they are easy to
visualize. The &configs module hijacks the PDB format to
deliver more information about each conformation in the PDB REMARK
fields. Look at the top of Conf5.pdb:
HEADER  Printed by mdgx

REMARK  4

REMARK  4 Topology used to create this configuration:

REMARK  4   HID.top

REMARK  4

REMARK  4 Restraints used to create this configuration:

REMARK  4 &rst

REMARK  4  iat=15,17,19,32,

REMARK  4  r1=-196.1479, r2=-167.5000, r3=-147.5000,
r4=-118.8521,

REMARK  4  rk2=64.0000, rk3=64.0000,

REMARK  4 &end

...

REMARK   4 &rst

REMARK   4  iat=25,24,21,19,

REMARK   4  r1=149.6376, r2=178.2855, r3=178.2855, r4=206.9334,

REMARK   4  rk2=16.0000, rk3=16.0000,

REMARK   4 &end

REMARK   4

REMARK   4 Molecular mechanics energy decomposition (kcal/mol):

REMARK   4   Bond
  1.7605

REMARK   4   Angle
25.4248

REMARK   4   Dihedral
0.5556 (sum of proper and improper terms)

REMARK   4   van-der Waals       0.7023
(includes 1-4 interactions)

REMARK   4   Electrostatic     -30.9217 (includes 1-4
interactions)

REMARK   4   Restraints          1.3396

REMARK   4   Total energy       -1.1389 (includes
restraint energy)
The restraints given in that REMARK section are what
sander would read to perform the same optimization
in vacuo. It is an exercise for the reader to isolate the fifth
conformation and then make a short minimization input file with the attached
restraints to see that sander cannot, in fact, minimize the
structure any further. Notice how the sander restraints would
require atom numbers in the topology--this is another convenience of the
&configs module, that atoms may be specified by their names,
rather than counting their positions in the topology. The four restraint
parameters in each of the &rst namelists are also computed by
mdgx based on more intuitive input in the { } ranges. It is not
covered in this tutorial, but the user can also specify the point at which the
NMR restraints go from quadratic to linear.
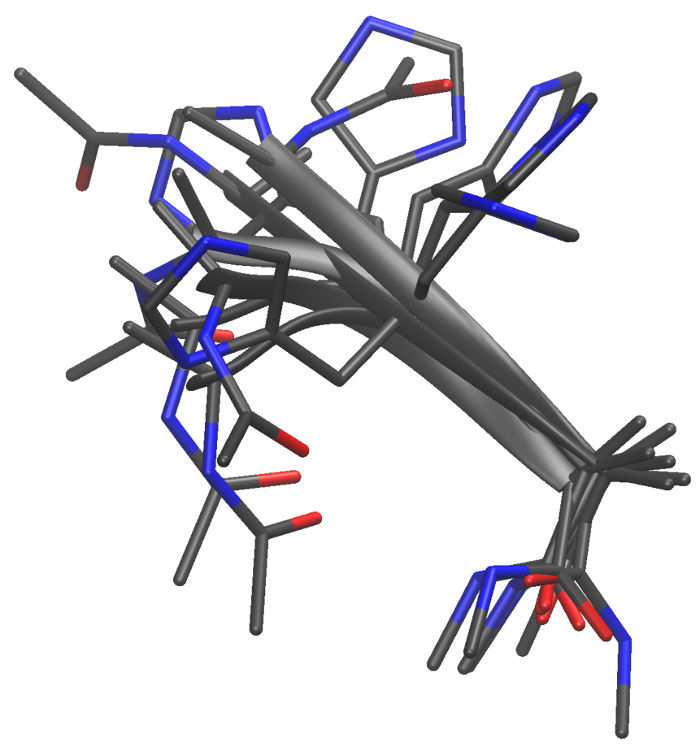
Here are some examples of the conformations produced:
The &configs module of mdgx makes it very
simple to manage huge numbers of elaborate energy minimizations for
manipulating small molecules in vacuo. The code has recently gained a
modest Generalized Born capability in other areas, so this feature may become
part of &configs in a future patch. For complex molecules
with 80-100 atoms, the minimizations can easily get stuck in local minima, or
access desired regions of conformational space only under great strain. In
these cases the shuffling feature is especially useful, as it can find less and
less strained ways to get the molecule's internal coordinates into the desired
conformations. Another feature that may be added, in time, is a loop builder
based on this technology.